Particle Animations
Ocean Particle Tracking: Pacific Equatorial Undercurrent Sources.
Published on May 29, 2022 by Annette Stellema
Particles Ocean EUC
1 min READ
Ocean Particle Tracking: Pacific Equatorial Undercurrent Sources
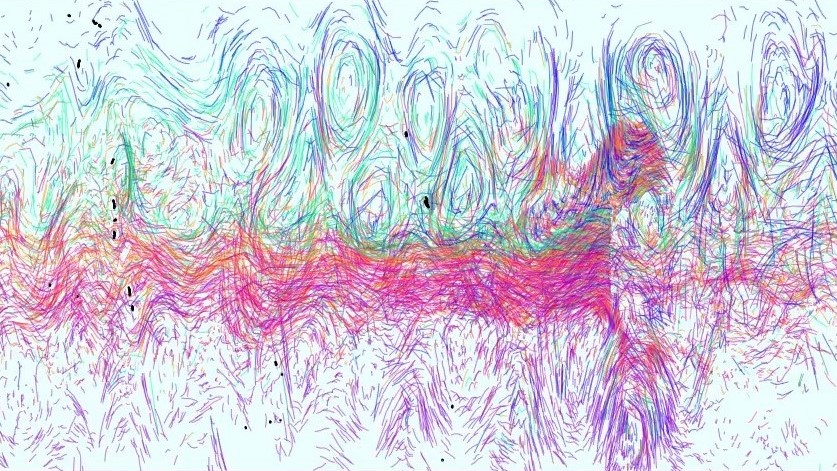
These animations show the sources and pathways of water that flows into the Equatorial Undercurrent (EUC) in the Pacific Ocean. The EUC flows eastward along the entire length of the Pacific, sitting just under the surface. I regularly insert particles in the EUC and back-track them to their source within a eddy-permitting ocean model. The animations are running back-wards in time, so keep in mind that the circulation is all flowing in the wrong direction. The particle colours indicate their source location (e.g., pink particles come from around the Solomon Islands).
The lines represent particle positions over a 6 day period, so longer lines indicate faster particles (i.e. travelled a further distance in the same amount of days) and vice versa.
Typically, during El Niño events, more water travels via the low-latitude western boundary currents and less comes from the interior. The opposite typically occurs during La Niña and we can see prominent tropical variability waves to the north and south of the EUC. In the ocean model, El Niño Southern oscillation events occur during 1991–1992 (El Niño), 1988–1989 (La Niña), 1986–1988 (El Niño), 1984–1985 (La Niña) and 1982–1983 (El Niño).
The particle trajectories were calculated using the OceanParcels library and the animation was created using python matplotlib.
Here are some other animations with particles initialisated at different longitudes:
The Equatorial Undercurrent at 165°E
The Equatorial Undercurrent at 220°E